I've written an R script that can be used in conjunction with a PostgreSQL spatially-enabled database to generate multiple catchment area polygons. It uses the pgr_pointsAsPolygon function from pgRouting, which draws an alpha shape around a given set of points.
This is useful for visualising the catchment areas around multiple sites or facilities. This script is a simplified version of one that I used to visualise railway station catchments for my PhD research. I had results from an on-train passenger survey, and for each passenger I knew their origin postcode and the railway station that they chose to depart from. I therefore wanted to visualise the observed station catchments as revealed by the survey, and due to the dataset size needed this to be an automated process.
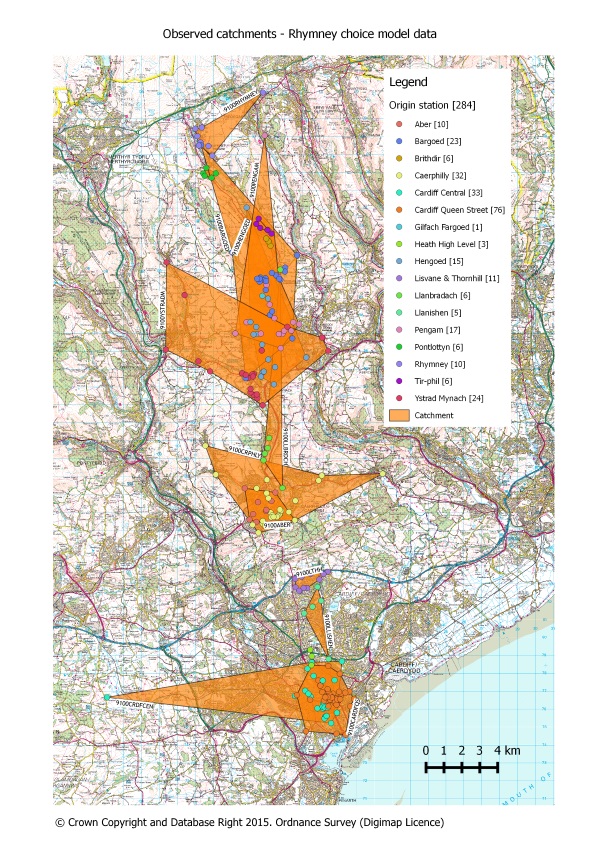
Here's an example of observed catchments generated for stations on the Rhymney line in South Wales.
Further information, and the R script can be found in my GitHub repository.